These maps illustrate how settlement diagnostics and planning outputs are used to support transparent, evidence-based dialogue with communities and county teams. They complement field surveys, enumeration, and engineering work carried out under KISRP.
Maps are programme working materials for orientation; final layouts, approvals, and public releases are governed by county planning processes and official communications.
Awelo
Siaya County
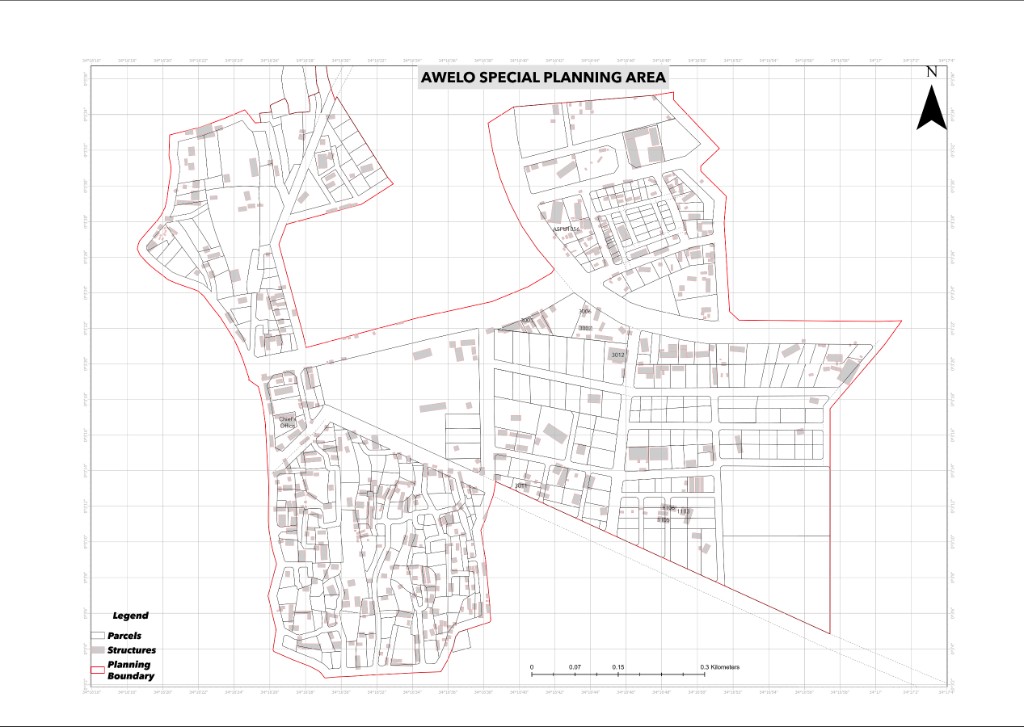
Siaya County — Awelo special planning area: parcels, structures, and the outer planning boundary.
The planning boundary (red outline) defines the study area. Inside it, parcels appear as outlined plots; structures are shown as grey footprints where buildings exist today.
Labels such as the Chief’s Office and parcel numbers support discussion on access, consolidation, and future upgrading. The grid, scale bar, and coordinates allow technical checks against field surveys.
Mathare (Umoja)
Kajiado County
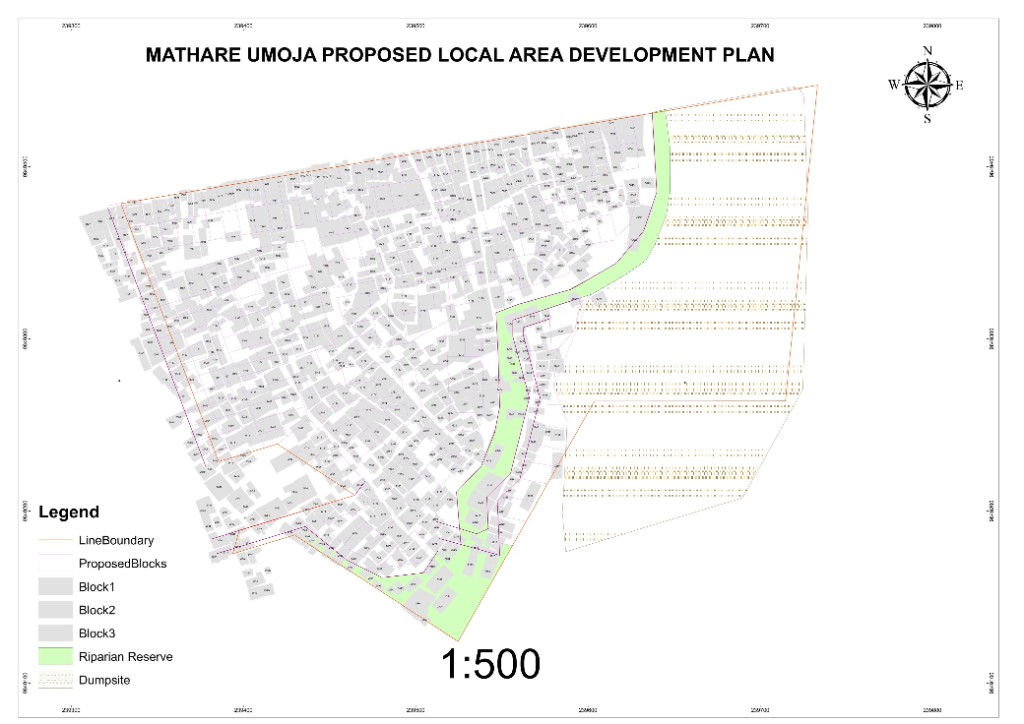
Kajiado County — Mathare Umoja local area development plan: existing blocks, riparian reserve, and proposed formal layout.
Mathare Umoja — proposed local area development plan
What this map shows
Existing built-up areas (Blocks 1–3, grey) show current dense development. A riparian reserve (light green) marks a protected corridor—typically along a watercourse—between existing settlement and new layout.
Proposed blocks to the east are drawn as regular plots, illustrating how structured expansion or formalisation could relate to access and services. Other symbols (e.g. dumpsite, boundary line) should be read together with environmental and engineering assessments.
Prison Kiwandani
Kilifi County
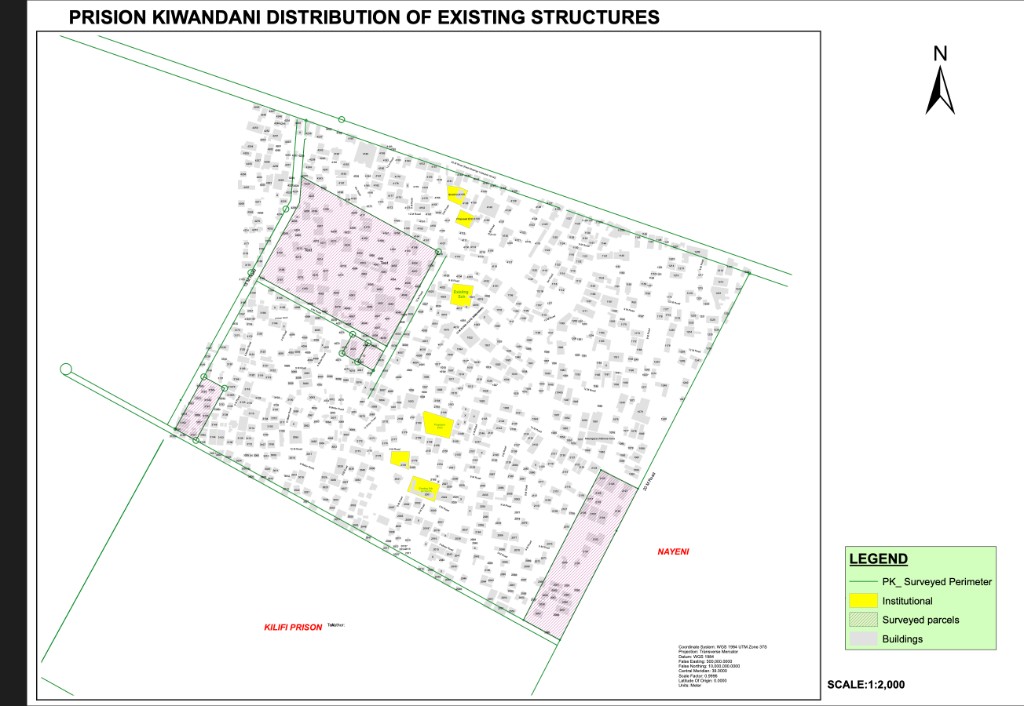
Kilifi County — Prison Kiwandani: existing structure survey and draft land-use plan (1:2,000).
The surveyed perimeter (green boundary) frames the pilot area. Buildings are shown as dense grey footprints; institutional zones (yellow) mark larger non-residential uses. Surveyed parcels (pink hatch) highlight plots already subject to detailed survey.
Context labels such as Kilifi Prison and neighbouring areas orient the site. Scale (1:2,000), north arrow, and coordinate reference support integration with wider county GIS.
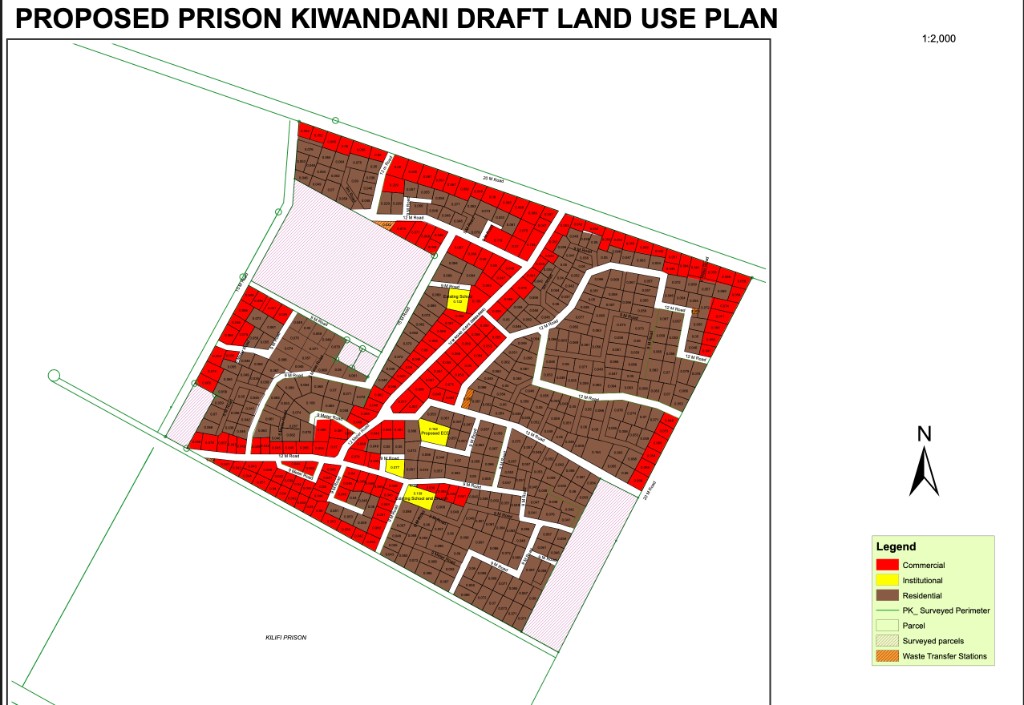
Proposed draft land use plan
What this map shows
The draft plan shows a road hierarchy (e.g. 20 m, 12 m, 9 m) and zoning: commercial (red) along main corridors, residential (brown) in blocks, and institutional (yellow) for schools and proposed ECD.
Surveyed parcels and utility symbols (e.g. waste transfer) illustrate how services and plot layouts could evolve. The plan is a technical basis for discussion—not a final cadastral document until adopted through statutory processes.